Showing posts with label Summary. Show all posts
Learning SAS: How to create a SAS report in .html file using ODS?
In our previous blogposts, we discussed about different ways of tweaking the way we display our output. Now it's time for something more advanced. We're in the age of Web and sometimes our company might require our output in HTML format either to upload online or in the company's intranet portal, in either cases it's not efficient to give our output to a web designer and ask him/her to create a .html equivalent of our summary. Rather SAS has a great stuff called Output Delivery Syste (ODS in short) that can just push a .HTML file our report.
Problem 1:
Sending the output to an HTML file. Issue the appropriate commands to prevent SAS from creating a listing file. (19:1)
Solution:

Run the same procedures as shown in Problem 1, except use the JOURNAL (or FANCYPRINTER) style instead of the default style. (19:3)
Solution:

Problem 1:
Sending the output to an HTML file. Issue the appropriate commands to prevent SAS from creating a listing file. (19:1)
Solution:
ods listing close;
ods html file='/folders/myfolders/iSAS/Assignment/2/college_report.html';

title "Sending Output to an HTML File";

proc print data=A15001.A01_college(obs=8) noobs;
run;

proc means data=A15001.A01_college n mean maxdec=2;
    var GPA ClassRank;
run;

ods;
Output:

Problem 2:
Run the same procedures as shown in Problem 1, except use the JOURNAL (or FANCYPRINTER) style instead of the default style. (19:3)
Solution:
ods listing close;
ods html file='/folders/myfolders/iSAS/Assignment/2/college_report.html'
    style=FancyPrinter;

title "Sending Output to an HTML File";

proc print data=A15001.A01_college(obs=8) noobs;
run;

proc means data=A15001.A01_college n mean maxdec=2;
    var GPA ClassRank;
run;

ods;
Output:

Learning:
- How to use ODS to output a HTML file of the report
- How to use different styles while creating the HTML report file using ODS
Learning SAS: How to sort variables while displaying the frequency output?
Sometimes it's not desirable just to display the output of the PROC FREQ as it is. As an analyst, sometimes our organization would require us to tweak it a bit.

Problem:
Using the SAS data set Blood, produce a table of frequencies for BloodType, in
frequency order. (17:7)
Solution:
/*Using the SAS data set Blood, produce a table of frequencies for BloodType, in
frequency order.*/


TITLE 'FREQUENCY OF CHOLESTROL GROUPED ORDERED BY INPUT DATA';
PROC FREQ DATA=A15001.A01_BLOOD ORDER=DATA;
 TABLE BLOODTYPE;
RUN;

TITLE 'FREQUENCY OF CHOLESTROL GROUPED ORDERED BY INPUT FREQUENCY';
PROC FREQ DATA=A15001.A01_BLOOD ORDER=FREQ;
 TABLE BLOODTYPE;
RUN;
TITLE;


Output:

Learning:
- How to change the order of variables displayed in the PROC FREQ Output
Learning SAS: Counting Frequencies - PROC FREQ
As PROC MEANS is very helpful in performing various operations on Numeric variables, PROC FREQ can be used to count frequencies of both character and numeric variables,
in one-way, two-way (Crosstabs/Contingency Tables), and three-way tables.
Problem 1:
Using the SAS data set Blood, generate one-way frequencies for the variables Gender, BloodType, and AgeGroup. Use the appropriate options to omit the cumulative statistics and percentages (17.1)
Input:

Solution:
Output:

in one-way, two-way (Crosstabs/Contingency Tables), and three-way tables.
Problem 1:
Using the SAS data set Blood, generate one-way frequencies for the variables Gender, BloodType, and AgeGroup. Use the appropriate options to omit the cumulative statistics and percentages (17.1)
Input:

Solution:
Title 'Frequency of Gender BloodType Age group without Cum.Freq. and %';
PROC FREQ DATA=A15001.A01_BLOOD;
 TABLE GENDER BLOODTYPE AGEGROUP /NOCUM NOPERCENT;
RUN;
Title;
Output:

Learning:
- How to use PROC FREQ to build a one-way frequency table
- Different Options of PROC FREQ like NOCUM and NOPERCENT
Learning SAS: Summarizing Data (PROC MEANS)
We've seen the basic data manipulation options with SAS in our previous blogpost and it's time for us to understand how to report those processed data. And the first think that comes in this journey is PROC MEANS.
People think of PROC MEANS just as a way to calculate summary statistics of numeric values but these procedures are much more versatile and can be used to create summary data sets that can then be analyzed with more DATA or PROC steps.
Problem 1:
Using the SAS data set College, compute the mean, median, minimum, and maximum and the number of both missing and non-missing values for the variables ClassRank and GPA. Report the statistics to two decimal places. (Ref: Learning SAS by Example, Ron Cody, Chapter 16, Problem 1)
Input Data:

Solution:
Title 'Summary Statistics of ClassRank & GPA with two decimal pts';

proc means data=A15001.A01_College Mean Median Min Max NMiss N Maxdec=2;
    var ClassRank GPA;
run;

Title;
Output:

Problem 2:
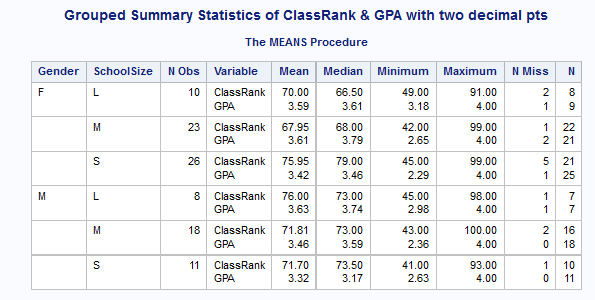
Repeat Problem 1, except compute the desired statistics for each combination of Gender SchoolSize. Do this twice, once using a BY statement, and once using a CLASS statement.
Solution:
Title 'Grouped Summary Statistics of ClassRank & GPA with two decimal pts';

proc means data=A15001.A01_College Mean Median Min Max NMiss N Maxdec=2;
    Class Gender SchoolSize;
    var ClassRank GPA;
run;

Title;

/* Grouping with BY */
proc sort data=A15001.A01_College out=sorted_college;
    by Gender Schoolsize;
run;

Title 'Grouped Summary Statistics of ClassRank & GPA with two decimal pts';

proc means data=sorted_college Mean Median Min Max NMiss N Maxdec=2;
    by Gender SchoolSize;
    var ClassRank GPA;
run;

Title;
Output:

Learning:
- Different ways of using PROC MEANS
- Various options of PROC MEANS like MAXDEC
- Grouping PROC MEANS Summary statistics


