- Back to Home »
- Learning , PROC FREQ , SAS »
- Learning SAS: How to handle missing values while counting frequencies
Posted by : Netbloggy
Friday, October 2, 2015
Missing values are very obvious in any raw dataset and it's very important for an analyst to know to how to handle them. Especially while counting frequencies, Missing values can give misleading figures.
Problem:
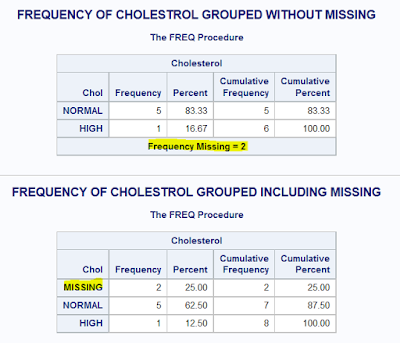
Using the data set Blood, produce frequencies for the variable Chol (cholesterol). Use a format to group the frequencies into three groups: low to 200 (normal), 201 and higher (high), and missing. Run PROC FREQ twice, once using the MISSING option, and once without. Compare the percentages in both listings.
Solution:
PROC FORMAT;
 VALUE CHOLGRP
  LOW-200 = 'NORMAL'
  201-HIGH = 'HIGH'
  OTHER = 'OTHERS';
RUN;

TITLE 'FREQUENCY OF CHOLESTROL GROUPED WITHOUT MISSING';
PROC FREQ DATA=A15001.A01_BLOOD;
 TABLE CHOL;
 FORMAT CHOL CHOLGRP.;
RUN;


PROC FORMAT;
 VALUE CHOLGRP
  LOW-200 = 'NORMAL'
  201-HIGH = 'HIGH'
  . = 'MISSING'
  OTHER = 'OTHERS';
RUN;

TITLE 'FREQUENCY OF CHOLESTROL GROUPED INCLUDING MISSING';
PROC FREQ DATA=A15001.A01_BLOOD;
 TABLE CHOL /MISSING;
 FORMAT CHOL CHOLGRP.;
RUN;
TITLE;
Output:
Learning:
- How to group variables while displaying the frequency using PROC FREQ
- How to use user-defined formats in PROC FREQ
- How to handle missing values in PROC FREQ


