Archive for 2015
MxxN = M^M^M^....M for N times - Interview Question (DP Analytics) [Solved in Python]
DP Analytics, a well-known analytics company came up with an interestingly logical written interview test.
Question:
2xx2 = 4
2xx3 = 16
2xx4 = 65536 = 2^16
3xx2 = 27
3xx3 = 7625597484987 = 3^27
4x3 = 64
2xxx3 = 65536
2xxx3 = 2xxx4
In general,
MxxN = M^M^M^....^M for N times
MxxxN = MxxMxxMxx.....xxM (N times)
and so on
Let the symbol 'x' be represented by a computer function 'T'. The inputs to
'T' function are(left number, number of x, right number). so,
T(2,2,2)=4
T(2,2,3)=16
T(2,4,3)=T(2,3,4)

Solution:
Question:
2xx2 = 4
2xx3 = 16
2xx4 = 65536 = 2^16
3xx2 = 27
3xx3 = 7625597484987 = 3^27
4x3 = 64
2xxx3 = 65536
2xxx3 = 2xxx4
In general,
MxxN = M^M^M^....^M for N times
MxxxN = MxxMxxMxx.....xxM (N times)
and so on
Let the symbol 'x' be represented by a computer function 'T'. The inputs to
'T' function are(left number, number of x, right number). so,
T(2,2,2)=4
T(2,2,3)=16
T(2,4,3)=T(2,3,4)
Solution:
def T(m,t,n):

    if t == 1:
        result = m ** n
        return result
    n = n + (t-2)
    result = m
    while(n>1):
        result = m ** result
        n = n-1
    return result

print T(3,2,3)
print T(2,2,3)
print T(4,1,3)
Understanding: For t=2, N-1 is the number of times M must be raised to the power of itself (eg: when N is 2, then M ^ M and when N is 3, then M ^ M ^ M) We built a logic that is only valid for xx hence if the number of x is greater than two then it is brought down to 2 and N is incremented by the same count, and when x is one, M ^ N is the actual result. Happy Coding!
Learning SAS: How to draw simple BAR charts in SAS?
Any data analysis is not complete without visualization and now it's time for us to learn how to draw simple BAR charts in SAS. We've used PROC SGPLOT to illustrate this. SGPLOT works fine in SAS University Edition too.
Output:


Problem 1:
Using the SAS data set Bicycles, produce two vertical bar charts showing frequencies for Country and Model.
Solution:
*Data set BICYCLES;

data A15001.A01_bicycles;
    input Country  & $25. Model    & $14. Manuf    : $10. Units    :   5.
        UnitCost :  comma8.;
    TotalSales=(Units * UnitCost) / 1000;
    format UnitCost TotalSales dollar10.;
    label TotalSales="Sales in Thousands" Manuf="Manufacturer";
    datalines;
USA  Road Bike  Trek 5000 $2,200
USA  Road Bike  Cannondale 2000 $2,100
USA  Mountain Bike  Trek 6000 $1,200
USA  Mountain Bike  Cannondale 4000 $2,700
USA  Hybrid  Trek 4500 $650
France  Road Bike  Trek 3400 $2,500
France  Road Bike  Cannondale 900 $3,700
France  Mountain Bike  Trek 5600 $1,300
France  Mountain Bike  Cannondale  800 $1,899
France  Hybrid  Trek 1100 $540
United Kingdom  Road Bike  Trek 2444 $2,100
United Kingdom  Road Bike  Cannondale  1200 $2,123
United Kingdom  Hybrid  Trek 800 $490
United Kingdom  Hybrid  Cannondale 500 $880
United Kingdom  Mountain Bike  Trek 1211 $1,121
Italy  Hybrid  Trek 700 $690
Italy  Road Bike  Trek 4500  $2,890
Italy  Mountain Bike  Trek 3400  $1,877
;

title 'Frequency of Countries';
proc sgplot data=A15001.A01_bicycles;
    vbar Country;
    xaxis label='Names of Country';
run;

title 'Frequency of Models';
proc sgplot data=A15001.A01_bicycles;
    hbar Model;
    xaxis label='Count';
run;
Output:
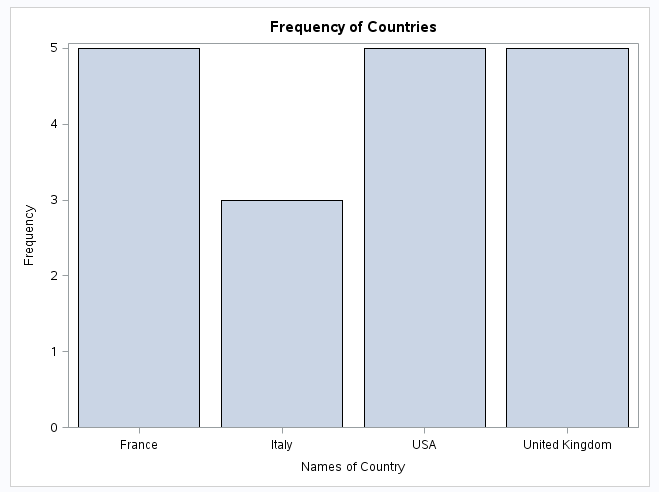

Learning:
- How to draw simple graphs in SAS using SGPLOT
- How to use different options like XAXIS LABEL while creating BAR Graphs
Learning SAS: How to create a SAS report in .html file using ODS?
In our previous blogposts, we discussed about different ways of tweaking the way we display our output. Now it's time for something more advanced. We're in the age of Web and sometimes our company might require our output in HTML format either to upload online or in the company's intranet portal, in either cases it's not efficient to give our output to a web designer and ask him/her to create a .html equivalent of our summary. Rather SAS has a great stuff called Output Delivery Syste (ODS in short) that can just push a .HTML file our report.
Problem 1:
Sending the output to an HTML file. Issue the appropriate commands to prevent SAS from creating a listing file. (19:1)
Solution:

Run the same procedures as shown in Problem 1, except use the JOURNAL (or FANCYPRINTER) style instead of the default style. (19:3)
Solution:

Problem 1:
Sending the output to an HTML file. Issue the appropriate commands to prevent SAS from creating a listing file. (19:1)
Solution:
ods listing close;
ods html file='/folders/myfolders/iSAS/Assignment/2/college_report.html';

title "Sending Output to an HTML File";

proc print data=A15001.A01_college(obs=8) noobs;
run;

proc means data=A15001.A01_college n mean maxdec=2;
    var GPA ClassRank;
run;

ods;
Output:

Problem 2:
Run the same procedures as shown in Problem 1, except use the JOURNAL (or FANCYPRINTER) style instead of the default style. (19:3)
Solution:
ods listing close;
ods html file='/folders/myfolders/iSAS/Assignment/2/college_report.html'
    style=FancyPrinter;

title "Sending Output to an HTML File";

proc print data=A15001.A01_college(obs=8) noobs;
run;

proc means data=A15001.A01_college n mean maxdec=2;
    var GPA ClassRank;
run;

ods;
Output:

Learning:
- How to use ODS to output a HTML file of the report
- How to use different styles while creating the HTML report file using ODS
Learning SAS: How to sort variables while displaying the frequency output?
Sometimes it's not desirable just to display the output of the PROC FREQ as it is. As an analyst, sometimes our organization would require us to tweak it a bit.

Problem:
Using the SAS data set Blood, produce a table of frequencies for BloodType, in
frequency order. (17:7)
Solution:
/*Using the SAS data set Blood, produce a table of frequencies for BloodType, in
frequency order.*/


TITLE 'FREQUENCY OF CHOLESTROL GROUPED ORDERED BY INPUT DATA';
PROC FREQ DATA=A15001.A01_BLOOD ORDER=DATA;
 TABLE BLOODTYPE;
RUN;

TITLE 'FREQUENCY OF CHOLESTROL GROUPED ORDERED BY INPUT FREQUENCY';
PROC FREQ DATA=A15001.A01_BLOOD ORDER=FREQ;
 TABLE BLOODTYPE;
RUN;
TITLE;


Output:

Learning:
- How to change the order of variables displayed in the PROC FREQ Output
Learning SAS: How to handle missing values while counting frequencies
Missing values are very obvious in any raw dataset and it's very important for an analyst to know to how to handle them. Especially while counting frequencies, Missing values can give misleading figures.
Problem:
Using the data set Blood, produce frequencies for the variable Chol (cholesterol). Use a format to group the frequencies into three groups: low to 200 (normal), 201 and higher (high), and missing. Run PROC FREQ twice, once using the MISSING option, and once without. Compare the percentages in both listings.
Solution:
Output:
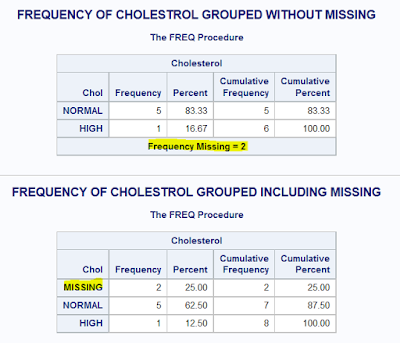
Problem:
Using the data set Blood, produce frequencies for the variable Chol (cholesterol). Use a format to group the frequencies into three groups: low to 200 (normal), 201 and higher (high), and missing. Run PROC FREQ twice, once using the MISSING option, and once without. Compare the percentages in both listings.
Solution:
PROC FORMAT;
 VALUE CHOLGRP
  LOW-200 = 'NORMAL'
  201-HIGH = 'HIGH'
  OTHER = 'OTHERS';
RUN;

TITLE 'FREQUENCY OF CHOLESTROL GROUPED WITHOUT MISSING';
PROC FREQ DATA=A15001.A01_BLOOD;
 TABLE CHOL;
 FORMAT CHOL CHOLGRP.;
RUN;


PROC FORMAT;
 VALUE CHOLGRP
  LOW-200 = 'NORMAL'
  201-HIGH = 'HIGH'
  . = 'MISSING'
  OTHER = 'OTHERS';
RUN;

TITLE 'FREQUENCY OF CHOLESTROL GROUPED INCLUDING MISSING';
PROC FREQ DATA=A15001.A01_BLOOD;
 TABLE CHOL /MISSING;
 FORMAT CHOL CHOLGRP.;
RUN;
TITLE;
Output:

Learning:
- How to group variables while displaying the frequency using PROC FREQ
- How to use user-defined formats in PROC FREQ
- How to handle missing values in PROC FREQ
Learning SAS: Counting Frequencies - PROC FREQ
As PROC MEANS is very helpful in performing various operations on Numeric variables, PROC FREQ can be used to count frequencies of both character and numeric variables,
in one-way, two-way (Crosstabs/Contingency Tables), and three-way tables.
Problem 1:
Using the SAS data set Blood, generate one-way frequencies for the variables Gender, BloodType, and AgeGroup. Use the appropriate options to omit the cumulative statistics and percentages (17.1)
Input:

Solution:
Output:

in one-way, two-way (Crosstabs/Contingency Tables), and three-way tables.
Problem 1:
Using the SAS data set Blood, generate one-way frequencies for the variables Gender, BloodType, and AgeGroup. Use the appropriate options to omit the cumulative statistics and percentages (17.1)
Input:

Solution:
Title 'Frequency of Gender BloodType Age group without Cum.Freq. and %';
PROC FREQ DATA=A15001.A01_BLOOD;
 TABLE GENDER BLOODTYPE AGEGROUP /NOCUM NOPERCENT;
RUN;
Title;
Output:

Learning:
- How to use PROC FREQ to build a one-way frequency table
- Different Options of PROC FREQ like NOCUM and NOPERCENT
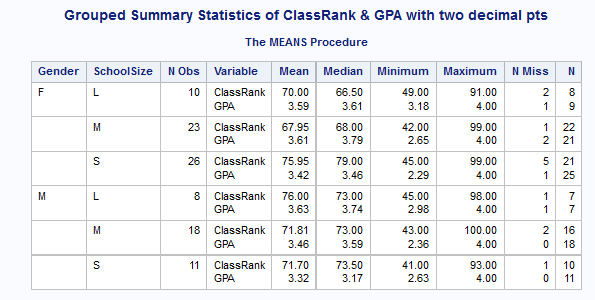
Learning SAS: How to create Summary Dataset using PROC MEANS
As we mentioned in the previous post, PROC MEANS is our handy option to create a new summary dataset that can be used in other data steps or Procedures. Here we'll show how to create a summary dataset using PROC MEANS.
Problem:
Using the SAS data set College, create a summary data set (call it Class_Summary) containing the n, mean, and median of ClassRank and GPA for each value of SchoolSize. Use a CLASS statement and be sure that the summary data set only contains statistics for each level of SchoolSize. Use the AUTONAME option to name the variables in this data set.
Solution:
Output:

Problem:
Using the SAS data set College, create a summary data set (call it Class_Summary) containing the n, mean, and median of ClassRank and GPA for each value of SchoolSize. Use a CLASS statement and be sure that the summary data set only contains statistics for each level of SchoolSize. Use the AUTONAME option to name the variables in this data set.
Solution:
/* create summary dataset from proc means */
/* NWAY to display only the Schoolsize level type */
proc means data=A15001.A01_College NOPRINT NWAY;
    CLASS SchoolSize;
    var ClassRank GPA;
    Output out=A15001.A01_Class_Summary N=Mean=Median= /Autoname;
run;

Title 'Grouped Summary Statistics of ClassRank & GPA by Schoolsize';

proc print data=A15001.A01_Class_summary;
run;

Title;
Output:

Learning:
- How to efficiently use PROC MEANS to create a summary dataset
- What's the purpose of NWAY option in PROC MEANS
- How to automatically name the variables in the newly created Summary dataset
Learning SAS: Summarizing Data (PROC MEANS)
We've seen the basic data manipulation options with SAS in our previous blogpost and it's time for us to understand how to report those processed data. And the first think that comes in this journey is PROC MEANS.
People think of PROC MEANS just as a way to calculate summary statistics of numeric values but these procedures are much more versatile and can be used to create summary data sets that can then be analyzed with more DATA or PROC steps.
Problem 1:
Using the SAS data set College, compute the mean, median, minimum, and maximum and the number of both missing and non-missing values for the variables ClassRank and GPA. Report the statistics to two decimal places. (Ref: Learning SAS by Example, Ron Cody, Chapter 16, Problem 1)
Input Data:

Solution:
Title 'Summary Statistics of ClassRank & GPA with two decimal pts';

proc means data=A15001.A01_College Mean Median Min Max NMiss N Maxdec=2;
    var ClassRank GPA;
run;

Title;
Output:

Problem 2:
Repeat Problem 1, except compute the desired statistics for each combination of Gender SchoolSize. Do this twice, once using a BY statement, and once using a CLASS statement.
Solution:
Title 'Grouped Summary Statistics of ClassRank & GPA with two decimal pts';

proc means data=A15001.A01_College Mean Median Min Max NMiss N Maxdec=2;
    Class Gender SchoolSize;
    var ClassRank GPA;
run;

Title;

/* Grouping with BY */
proc sort data=A15001.A01_College out=sorted_college;
    by Gender Schoolsize;
run;

Title 'Grouped Summary Statistics of ClassRank & GPA with two decimal pts';

proc means data=sorted_college Mean Median Min Max NMiss N Maxdec=2;
    by Gender SchoolSize;
    var ClassRank GPA;
run;

Title;
Output:

Learning:
- Different ways of using PROC MEANS
- Various options of PROC MEANS like MAXDEC
- Grouping PROC MEANS Summary statistics
Learning SAS: Character Functions
Like various numeric functions that help us to process numeric data, SAS has a bunch of Character Functions to easily process Characters.
Problem:
Clean the input data where Weight & Height are characters but remove
the units after the numbers & type convert them to numbers
Solution:
Output:
 Learning:
Problem:
Clean the input data where Weight & Height are characters but remove
the units after the numbers & type convert them to numbers
Solution:
/* Clean the input data where Weight & Height are characters but remove
the units after the numbers & type convert them to numbers */

data A15001.A01_nuts;
	input weight $ height $;
	datalines;
	100kgs. 59cm
	180KG 60CM.
	88kg. 160cms
	50kgs 100cm
	;

Title 'Source Data';
proc print data=A15001.A01_nuts; run;Title;
* find() to find 'kg' and 'cm' in the input set
returns the position of the matched string;

data A15001.A01_fixit;
	set A15001.A01_nuts(rename = (weight = char_wt
						height = char_ht));
	if find(char_wt,'kg','i') then
			weight = input(compress(char_wt,,'kd'),8.);
	if find(char_ht,'cm','i') then
			height= input(compress(char_ht,,'kd'),8.);
	drop char_:;
run;

Title 'Formatted Data';
proc print data=A15001.A01_fixit; run;Title;
Output:

- Understanding Basic character functions
- Converting Character variable to Numeric variable using input (put for the opposite of it)
Learning SAS: Tweaking PROC PRINT to display the data
PROC PRINT in SAS has a lot of options which can help us tweak the way we display our data.
Options like n = caption of summary, firstobs = no. of first observations & obs = last observation to be processed.
Problem 1:
List the first 6 observations in data set Blood. Include only the variables Subject,
WBC (white blood cell), RBC (red blood cell), and Chol. Label the last three
variables “White Blood Cells,” “Red Blood Cells,” and “Cholesterol,” respectively.
Omit the Obs column, and place Subject in the first column. Be sure the column
headings are the variable labels, not the variable names.
Solution:
Output:
 Learning:
Problem 2:
List the four observations from data set Blood (3-6). Also group the output report by
BloodType.
Solution:
Output:
 Learning:
Options like n = caption of summary, firstobs = no. of first observations & obs = last observation to be processed.
Problem 1:
List the first 6 observations in data set Blood. Include only the variables Subject,
WBC (white blood cell), RBC (red blood cell), and Chol. Label the last three
variables “White Blood Cells,” “Red Blood Cells,” and “Cholesterol,” respectively.
Omit the Obs column, and place Subject in the first column. Be sure the column
headings are the variable labels, not the variable names.
Solution:
proc print data=A15001.A01_Blood
			(obs=6)
			n = 'No. of Observations = '
			label; /* printing only 6 obs */
	label WBC = 'White Blood Cells'
		RBC = 'Red Blood Cells'
			Chol = 'Cholesterol';
		ID Subject;	 /* omit obs & place the id variable at first */
		var WBC RBC Chol;
run;
Output:

- Different options of PROC PRINT
Problem 2:
List the four observations from data set Blood (3-6). Also group the output report by
BloodType.
Solution:
/* sorting before using grouping in PROC PRINT */
proc sort data=A15001.A01_Blood; by BloodType; run;

proc print data=A15001.A01_Blood
			(firstobs=3 obs=6) /* printing only 4 obs */
			n = 'No. of Observations = ';
	 	by BloodType;
		ID Subject;	 /* omit obs & place the id variable at first */
		var WBC RBC Chol;
run;
Output:

- Using BY to group the output in PROC PRINT
- Using FirstObs to select a start point while displaying the output
Learning SAS: Arrays in SAS
Unlike many other programming languages, Arrays in SAS don't store the values but just the pointers to the actual values (very much like C Pointers).
Problem:
Using the SAS data set Scores, create a new, temporary SAS data set (reversed)
where the values of the variables test1–test5 are reversed as follows: 1 -> 5; 2
-> 4; 3 -> 3; 4 -> 2; 5 -> 1.
Solution:
Output:
 Learning:
Problem:
The passing score on each of five tests is 65, 70, 60, 62, and 68. Using the data here, use a temporary array to count the number of tests passed by each student.
Solution:
Output:
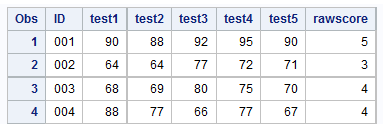 Learning:
Download the code here
Problem:
Using the SAS data set Scores, create a new, temporary SAS data set (reversed)
where the values of the variables test1–test5 are reversed as follows: 1 -> 5; 2
-> 4; 3 -> 3; 4 -> 2; 5 -> 1.
Solution:
data A15001.A01_scores;
 input ID $ test1-test5;
 datalines;
 001 90 88 92 95 90
 002 64 64 77 72 71
 003 68 69 80 75 70
 004 88 77 66 77 67
 ;
run;

data A15001.A01_reversed;
 set A15001.A01_scores;
 array test{5};
 array ques{5} ques1-ques5;
 j = 5;
 do i = 1 to 5;
  ques{j} = test{i};
  put j= i= ques{j}= test{i}=;
  j + (-1);
 end;

 do i = 1 to 5;
  test{i} = ques{i};
 end;
 drop ques1-ques5 i j;
run;

Title 'The actual scores';
proc print data=A15001.A01_scores;run;
title;
Title 'The reversed scores';
proc print data=A15001.A01_reversed; run;
title;
Output:

- How to efficiently use Arrays to reverse a series of numbers
- Drop not-required Arrays
Problem:
The passing score on each of five tests is 65, 70, 60, 62, and 68. Using the data here, use a temporary array to count the number of tests passed by each student.
Solution:
data A15001.A01_passing;
 set A15001.A01_scores;
 array passscore{5} _temporary_ (65,70,60,62,68);
 array test[5];
 rawscore = 0;
 do tst = 1 to 5;
  rawscore + (test{tst} ge passscore{tst});
 end;
 drop tst;
run;

proc print data=A15001.A01_passing; run;
Output:

- Creating temporary array using _temporary_
Download the code here
Learning SAS: Numeric Functions
Sometimes it's just easier to use in-built SAS functions while processing the data rather than writing many complex statements in the DATA step. This is a simple peek into some of the numeric functions of SAS.
Problem:
Count the number of missing values for WBC, RBC, and Chol in the Blood data set.
Use the MISSING function to detect missing values.
Solution:
Output:

Learning:
How to use Missing() function to processing numeric data with missing values
Problem:
Create a new, temporary SAS data set (Miss_Blood) based on the SAS data set
Blood. Set Gender, RBC, and Chol to a missing value if WBC is missing. Use the
MISSING and CALL MISSING functions in this program.
Solution:
Output:

Learning:
How to use CALL Routine with Missing function
Download the code here
Problem:
Count the number of missing values for WBC, RBC, and Chol in the Blood data set.
Use the MISSING function to detect missing values.
Solution:
data A15001.A01_MissingVals;
 set A15001.A01_Blood;
 if missing(WBC) then Miss_WBC + 1; /* missing() to detect missing and + sum function to increment */
 if missing(RBC) then Miss_RBC + 1;
 if missing(Chol) then Miss_Chol + 1;
run;

proc print data=A15001.A01_MissingVals noobs; run;
Output:

Learning:
How to use Missing() function to processing numeric data with missing values
Problem:
Create a new, temporary SAS data set (Miss_Blood) based on the SAS data set
Blood. Set Gender, RBC, and Chol to a missing value if WBC is missing. Use the
MISSING and CALL MISSING functions in this program.
Solution:
data A15001.A01_Miss_Blood;
 set A15001.A01_Blood;
 if missing(WBC) then CALL Missing(of Gender RBC Chol);
run;

proc print data=A15001.A01_Miss_Blood; run;
Output:

Learning:
How to use CALL Routine with Missing function
Download the code here
Learning SAS: Subsetting & Combining SAS Data sets
As we've learnt how to process our input data with conditions and loops, it's also equally important for us to process our SAS datasets - more prominent of which are Subsetting & Combining SAS Data sets.
Output:


Problem:
Using the SAS data set Blood, create two temporary SAS data sets by selecting all
subjects with cholesterol levels (Chol) below 100. Do this using a single DATA step.
Input:
libname A15001 '/folders/myfolders/iSAS/Assignment';

data A15001.A01_Blood;
   infile '/folders/myfolders/iSAS/blood.txt' truncover;
   length Gender $ 6 BloodType $ 2 AgeGroup $ 5;
   input Subject
         Gender
         BloodType
         AgeGroup
         WBC
         RBC
         Chol;
   label Gender = "Gender"
         BloodType = "Blood Type"
         AgeGroup = "Age Group"
         Chol = "Cholesterol";
run;
Solution:
data A15001.A01_LowCholMale A15001.A01_LowCholFemale;
 set A15001.A01_Blood;
 where Chol lt 100 and not missing(Chol); *only entries of Blood with low chol are processed;
  if Gender = 'Female' then output A15001.A01_LowCholMale;
 else if Gender = 'Male' then output A15001.A01_LowCholFemale; /* else if because it's not mutually exclusive */
run;

title 'List of Low Cholestrol Male';
proc print data=A15001.A01_LowCholMale noobs;run;
title;

title 'List of Low Cholestrol Female';
proc print data=A15001.A01_LowCholFemale noobs;run;
title;
Output:


Learning:
- Using WHERE to subset SAS Datasets
- Creating multiple SAS Datasets in a single DATA step
- Controlling the implicit OUTPUT to write in specific dataset based on specific conditions
Learning SAS - Working with Dates
SAS offers a lot of flexible functions in reading and writing Dates. Let's explore some of it.
Problem 1:
Compute a person's age in years
Input:
001 10/21/1950 05122003 08/10/65 23Dec2005
002 01/01/1960 11122009 09/13/02 02Jan1960
Solution:
Output:
 Learning:
 Learning:
Download the code from here
Problem 1:
Compute a person's age in years
Input:
001 10/21/1950 05122003 08/10/65 23Dec2005
002 01/01/1960 11122009 09/13/02 02Jan1960
Solution:
data A15001.A01_Four_Dates;
infile '/folders/myfolders/iSAS/a01_dates.txt';
input @1 Subject $3.
@5 DOB mmddyy10.
@16 VisitDate mmddyy8.
@26 TwoDigit mmddyy8.
@34 LastDate date9.;

format DOB VisitDate LastDate mmddyy10.
  TwoDigit date9.;
run;

proc print data=A15001.A01_Four_Dates;
*format DOB VisitDate LastDate mmddyy10.
  TwoDigit date9.;
run;
*yearcutoff is to cutoff all those previous years;*options yearcutoff=1910;
data A15001.A01_Ages;
 set A15001.A01_Four_Dates;
 age1 = yrdif(DOB,VisitDate,'Actual'); *as of visitdate;
 age2 = yrdif(DOB,'05SEP2015'd,'Actual');*as of this date - date constant;
 age3 = yrdif(DOB,today(),'Actual'); *as of today;
run;

title "Listing of Age";
Proc print data=A15001.A01_Ages;
 id subject;
 var DOB VisitDate age1 age2 age3;
run;
Output:

- Reading date with date informat and write it in the dataset in a different date format
- Understanding the global option YEARCUTOFF to change the default yearcutoff to handle two-digit years
- Calculating Age (difference of years) with yrdif function
- Understanding Date constant - '19SEP2015'd
- Understanding today() function that outputs today's date
Problem 2:
Use mdy() & other such function to combine & extract month,week and day from a date and also calculate intervals between two dates.
Solution:
*extracting weekday, day, month and year;

data A01_Extract;
 set A15001.A01_Four_Dates;
 day = weekday(DOB);
 dayofmonth= day(DOB);
 Month = month(DOB);
 year = year(DOB);
run;

proc print data=A01_Extract noobs;
 var DOB Day -- Year;
run;

*creating date from month,day,year values;

data A01_MDY_Ex;
 set A01_Extract;
 dob_date = mdy(month,dayofmonth,year);
 format dob_date mmddyy10.;
run;

proc print data=A01_MDY_Ex;
var dob_date;
run;

*INTCK to calculate interval bw two dates;

data A01_Interval;
 set A01_MDY_Ex;
 yr_interval = INTCK('year',dob_date,today());
 qtr_interval = INTCK('qtr',dob_date,today());
run;

proc print data=A01_Interval;;
var dob_date yr_interval qtr_interval;
run;
Output:

- Understanding date functions like mdy(), day(), month(), year()
- Using INTCK function to calculate intervals (qtr, year, day, week) between two dates
Download the code from here
Learning SAS - Looping with Condition (DO WHILE & DO UNTIL)
We learnt about Conditional processing and Iterative Processing, but what if we could combine both of them and use effectively? Hence comes DO WHILE & DO UNTIL.
Problem 1:
Generate a table of integers and squares starting at 1 and ending when the square
value is greater than 100. Use either a DO UNTIL or DO WHILE statement to
accomplish this.
Solution:
Output:
 Learning:
Download the code here
Problem 1:
Generate a table of integers and squares starting at 1 and ending when the square
value is greater than 100. Use either a DO UNTIL or DO WHILE statement to
accomplish this.
Solution:
data A01_intsqrs;
 integer = 1;
 do while (square <= 100); /*do until (square > 100);*/
   square = integer ** 2;
   output;
   integer + 1;
 end;
run;

proc print data=A01_intsqrs; run;
Output:

- How DO-WHILE & DO-UNTIL works
- Controlling the loop with a condition
Download the code here
Learning SAS - Iterative Processing : Looping
The primary objective of computer is to compute mathematical computations of big scale faster than human beings. We humans can write down multiplication table of number 5 till 10th level or maybe 100th level, but we can make computer write down the same till 1000th or more too. And Iterative processing (looping) opens doors for such computing.
Problem 1:
Using this (Vital) data set, create a new data set (NewVitals) with the following new
variables:
For subjects less than 50 years of age:
If Pulse is less than 70, set PulseGroup equal to Low;
otherwise, set PulseGroup equal to High.
If SBP is less than 130, set SBPGroup equal to Low;
otherwise, set SBPGroup equal to High.
For subjects greater than or equal to 50 years of age:
If Pulse is less than 74, set PulseGroup equal to Low;
otherwise, set PulseGroup equal to High.
If SBP is less than 140, set SBPGroup equal to Low;
otherwise, set SBPGroup equal to High.
Output:
 Learning:
Problem 2:
Modify this program so that a new variable, SumSales, representing Sales to date, is
added to the data set. Be sure that the missing value for Sales in month 3 does not
result in a missing value for SumSales.
Solution:
Output:

Learning:
Problem 3: Create a temporary SAS data set from these three lines of data. Each observation should contain Method (A, B, or C), and Score. There should be 30 observations in this data set. Use a DO loop to create the Method variable and remember to use a single trailing @ in your INPUT statement. Provide a listing of this data set using PROC PRINT.
Solution:
Output:
 Learning:
Download the code here
Problem 1:
Using this (Vital) data set, create a new data set (NewVitals) with the following new
variables:
For subjects less than 50 years of age:
If Pulse is less than 70, set PulseGroup equal to Low;
otherwise, set PulseGroup equal to High.
If SBP is less than 130, set SBPGroup equal to Low;
otherwise, set SBPGroup equal to High.
For subjects greater than or equal to 50 years of age:
If Pulse is less than 74, set PulseGroup equal to Low;
otherwise, set PulseGroup equal to High.
If SBP is less than 140, set SBPGroup equal to Low;
otherwise, set SBPGroup equal to High.
libname A15001 '/folders/myfolders/iSAS/Assignment';

data A15001.A01_vitals;
 input ID : $3.
 Age
 Pulse
 SBP
 DBP;
 label SBP = "Systolic Blood Pressure"
 DBP = "Diastolic Blood Pressure";
datalines;
001 23 68 120 80
002 55 72 188 96
003 78 82 200 100
004 18 58 110 70
005 43 52 120 82
006 37 74 150 98
007 . 82 140 100
;
Solution:
data A15001.A01_new_vitals;
 set A15001.A01_vitals;
 if missing(age) then delete;
 else if age lt 50 then do;
  if pulse lt 70 then PulseGroup = 'Low';
  else PulseGroup = 'High';
  if SBP lt 130 then SBPGroup = 'Low';
  else SBPGroup = 'High';
 end;
 else if age ge 50 then do;
  if pulse lt 74 then PulseGroup ='Low';
  else PulseGroup = 'High';
  if SBP lt 140 then SBPGroup= 'Low';
  else SBPGroup = 'High';
 end;
run;

Title "Listing of New Vitals";
proc print data=A15001.A01_new_vitals noobs;
run;
Title;
Output:

- How to read input from another dataset
- How to use missing() function to identify missing value
- Using DO-END along with IF-ELSE-ELSE IF to do a set of tasks in more than one step
Problem 2:
Modify this program so that a new variable, SumSales, representing Sales to date, is
added to the data set. Be sure that the missing value for Sales in month 3 does not
result in a missing value for SumSales.
Solution:
data A01_monthsales;
 input month sales @@;
 SumSales + Sales; * sum function ignores missing value;
datalines;
1 4000 2 5000 3 . 4 5500 5 5000 6 6000 7 6500 8 4500
9 5100 10 5700 11 6500 12 7500
;

Title "Monthly Sales Report";
proc print data=A01_monthsales; run;
Title;
Output:

Learning:
- An Arithmetic computation can result in Missing value if at least one missing value is encountered
- Sum function -> Variable + Increment can increment the Variable without any initialization and also can handle missing value
- Sum function is also a good counter to use
- @@ - Double Trailing to hold more than one line to receive input
Problem 3: Create a temporary SAS data set from these three lines of data. Each observation should contain Method (A, B, or C), and Score. There should be 30 observations in this data set. Use a DO loop to create the Method variable and remember to use a single trailing @ in your INPUT statement. Provide a listing of this data set using PROC PRINT.
Solution:
data A15001.A01_speed;
 do method='A','B','C';
  do i = 1 to 10;
    input score @;
    output;
   end;
 end;
 drop i;
datalines;
250 255 256 300 244 268 301 322 256 333
267 275 256 320 250 340 345 290 280 300
350 350 340 290 377 401 380 310 299 399
;
run;
Output:

- Looping with Categorical Variable (Characters) as Index
- Nested Looping (Loop inside another Loop)
- @ - Single Trailing to hold the line for input
- Controlling the implicit output in the DATA step with OUTPUT statement
Download the code here
Learning SAS - Conditional Processing - IF-THEN-ELSE
The most important part of any programming language is conditional processing. The general syntax goes like this:
Problem 1 :
Create a temporary SAS data set called School. Using IF and ELSE IF statements, compute two new variables as follows: Grade (numeric), with a value of 6 if Age is 12 and a value of 8 if Age is 13. The quiz grades have numerical equivalents as follows: A = 95, B = 85, C = 75, D = 70, and F = 65. Using this information, compute a course grade (Course) as a weighted average of the Quiz (20%), Midterm (30%) and Final (50%).
Input Data:
12 A 92 95
12 B 88 88
13 C 78 75
13 A 92 93
12 F 55 62
13 B 88 82
Solution:
Output:

Learning:
if condition then
   --statements;
else if condition then
    -- more statements;
else if condition then
    -- more statements;
...
else
    -- other statements;
Problem 1 :
Create a temporary SAS data set called School. Using IF and ELSE IF statements, compute two new variables as follows: Grade (numeric), with a value of 6 if Age is 12 and a value of 8 if Age is 13. The quiz grades have numerical equivalents as follows: A = 95, B = 85, C = 75, D = 70, and F = 65. Using this information, compute a course grade (Course) as a weighted average of the Quiz (20%), Midterm (30%) and Final (50%).
Input Data:
12 A 92 95
12 B 88 88
13 C 78 75
13 A 92 93
12 F 55 62
13 B 88 82
Solution:
data A01_school;
 input Age Quiz : $1. Midterm Final;
 if Age = 12 then Grade = 6;
 else if Age = 13 then Grade = 8;
 Select(Quiz);
  when ('A') Quiz_Grade = 95;
  when ('B') Quiz_Grade = 85;
  when ('C') Quiz_Grade = 75;
  when ('D') Quiz_Grade = 70;
  when ('F') Quiz_Grade = 65;
  otherwise;
 end;
 Course_Grade = Quiz_Grade*.2 + Midterm*.3 + Final*.5;
 drop Quiz_Grade;
datalines;
12 A 92 95
12 B 88 88
13 C 78 75
13 A 92 93
12 F 55 62
13 B 88 82
;
run;

proc print data=A01_school;
run;
Output:
Learning:
- Setting Length of a character when it's less than 8 bytes to save memory
- How to use IF ELSE
- How to efficiently use SELECT to reduce repetitive IF ELSE
- Necessary to drop Not-Required Variables
Time to learn SAS with Free SAS University Edition & Ron Cody's book
In the age of Rs and Pythons, SAS is still the unconquered leader at least in the domain of Banking and Finance. SAS as a statistical package shares many similarities with Mainframe systems. Even after the rise of cloud computing and Distributed systems, Banking & Finance domain couldn't completely move away from Mainframe systems and the same is true with SAS too.
Hence it's important for an aspiring analyst to learn SAS (at least Base SAS) but how do we do that. SAS is an expensive package and that actually makes it tough to get your hands-on with SAS. But as open source counterparts like R & Python are growing, SAS has come down with a Free University Edition toattract help students. Let's use it and get started with SAS.

Learn How to install SAS University Edition on VirtualBox or VM Player
Fine, we've got the tool the play with but what to do with it? That's exactly what Ron Cody's book teaches us.
Learning SAS by Example: A Programmer's Guide

This is an excellent book with amazing flow of chapters. There couldn't be any better book other than this to get started with SAS. Happy learning :-)
Hence it's important for an aspiring analyst to learn SAS (at least Base SAS) but how do we do that. SAS is an expensive package and that actually makes it tough to get your hands-on with SAS. But as open source counterparts like R & Python are growing, SAS has come down with a Free University Edition to
Learn How to install SAS University Edition on VirtualBox or VM Player
Fine, we've got the tool the play with but what to do with it? That's exactly what Ron Cody's book teaches us.
Learning SAS by Example: A Programmer's Guide
This is an excellent book with amazing flow of chapters. There couldn't be any better book other than this to get started with SAS. Happy learning :-)
Solving "InternetOpenUrl failed: 'A connection with the server could not be established'" Error in RStudio
Just when I was trying to install a new package in my RStudio using install.package() or the GUI way, my RStudio suddenly threw a long error where "InternetOpenUrl failed: 'A connection with the server could not be established'" repeated often. That was funny because my internet connection was perfect and so googling about the same ended up in a Stack overflow page that had a huge set of instructions which made me worry more. Well, there is always a second search result when the first one is not working and that really helped.
To Solve this error, do this in your RStudio:
Tools -> Global Options -> Packages and unchecking the "Use Internet Explorer library/proxy for HTTP" option.
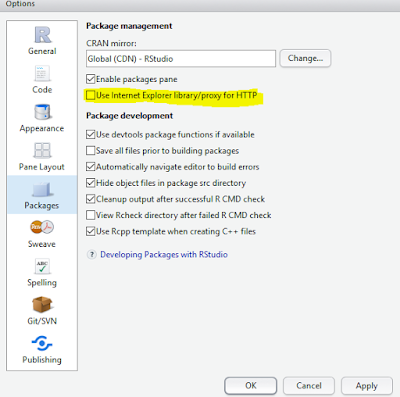
It was simply my internal proxy settings to be blamed. After all what would happen if you wanted to watch a cricket match live when it wasn't available in your country :-/
To Solve this error, do this in your RStudio:
Tools -> Global Options -> Packages and unchecking the "Use Internet Explorer library/proxy for HTTP" option.
It was simply my internal proxy settings to be blamed. After all what would happen if you wanted to watch a cricket match live when it wasn't available in your country :-/
Creating Histograms using matplotlib of Python [Hands-on]
Histogram is the best way to display frequency of a data and here we are to create one. So far we've dealt with text files and now it's time to show some progress and work with some real-world data hence this time, it's going to be a csv (comma-separated value) file from openflights.org.
Unlike text files, to process csv files, we need to import a package called csv . Also going forward in the program we need to calculate geo distance which is quite different from our normal distance calculation as the former deals with longitudes and latitudes so we've to download the python program geo_distance and import the function geo_distance into our program.
Let's dive deeper into the code. As you see below, we are working with two different input dataset 1. airports.dat to get airport details and 2. routes.dat to get route details. And now we've to calculate geo_distance from both those data and record it in a list distance[]
Now our data is ready and it's time for some storytelling. Let's create a histogram with hist().
Once you execute the code, a beautiful bluish histogram appears. Here it is:
 Download the source code here!
Unlike text files, to process csv files, we need to import a package called csv . Also going forward in the program we need to calculate geo distance which is quite different from our normal distance calculation as the former deals with longitudes and latitudes so we've to download the python program geo_distance and import the function geo_distance into our program.
import matplotlib.pyplot as plt
import csv
import geo_distance #for calculating dist b/w lats. and longs.
Let's dive deeper into the code. As you see below, we are working with two different input dataset 1. airports.dat to get airport details and 2. routes.dat to get route details. And now we've to calculate geo_distance from both those data and record it in a list distance[]
d = open("airports.dat.txt")
latitudes = {}
longitudes = {}
distances = []
for row in csv.reader(d):
    airport_id = row[0]
    latitudes[airport_id] = float(row[6])
    longitudes[airport_id] = float(row[7])

f = open("routes.dat")
for row in csv.reader(f):
    source_airport = row[3]
    dest_airport = row[5]
    if source_airport in latitudes and dest_airport in latitudes:
        source_lat = latitudes[source_airport]
        source_long = longitudes[source_airport]
        dest_lat = latitudes[dest_airport]
        dest_long = longitudes[dest_airport]
        distances.append(geo_distance.distance(source_lat,source_long,dest_lat,dest_long))
Now our data is ready and it's time for some storytelling. Let's create a histogram with hist().
plt.hist(distances, 100, facecolor='b')
plt.xlabel("Distance (km)")
plt.ylabel("Number of flights")


